
Solana Market Context in 2026
Solana is currently trading near $82, with a market capitalization hovering close to $48 billion as of May 2026. This valuation reflects a significant correction from earlier highs, with some analysis noting declines of up to 72% from peak levels. Despite this volatility, the network has maintained its position as a distinct non-EVM Layer-1 stack, attracting developers and users seeking alternatives to the Ethereum ecosystem.
The resilience of Solana's user base remains a central point of discussion among analysts. While price action has been turbulent, transaction volumes and active addresses suggest that underlying utility continues to support the network. The current trading range, often cited between $55 and $65 as a potential buy zone by some commentators, indicates a market in consolidation rather than collapse.
Long-term projections vary, with some sources questioning whether Solana can regain previous momentum in 2026. However, the network's technical infrastructure and growing ecosystem of decentralized applications provide a foundation for potential recovery. Investors are closely watching whether Solana can stabilize its price action while continuing to expand its developer activity and user adoption.
Solana technical indicators and price zones
Technical analysis for Solana in 2026 centers on identifying structural support and resistance levels through moving average crossovers and momentum indicators. The current market structure suggests a consolidation phase, with the 20-day and 50-day Exponential Moving Averages (EMA) acting as critical dynamic barriers. Recent data indicates the 20-day EMA at approximately $74.83 and the 50-day EMA at $75.44 have recently flipped, signaling a potential shift in short-term momentum (CoinDCX).
The projected price range for Solana in 2026 sits between $75 and $86, based on the prevailing EMA structure. This range reflects a moderate growth trajectory, with specific forecasts pointing to an average cost of $90.59 by December 2026 and a preliminary target of $76.56 by August 16, 2026 (Changelly). These levels serve as key reference points for traders assessing entry and exit strategies.
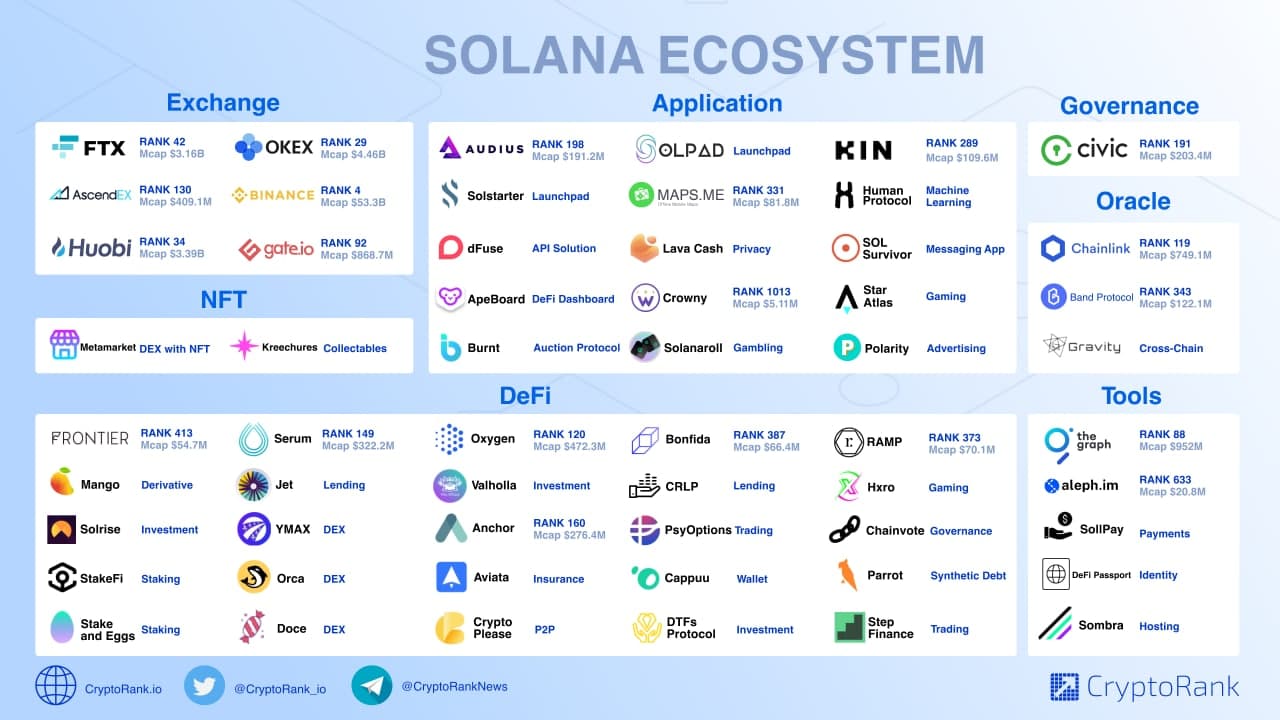
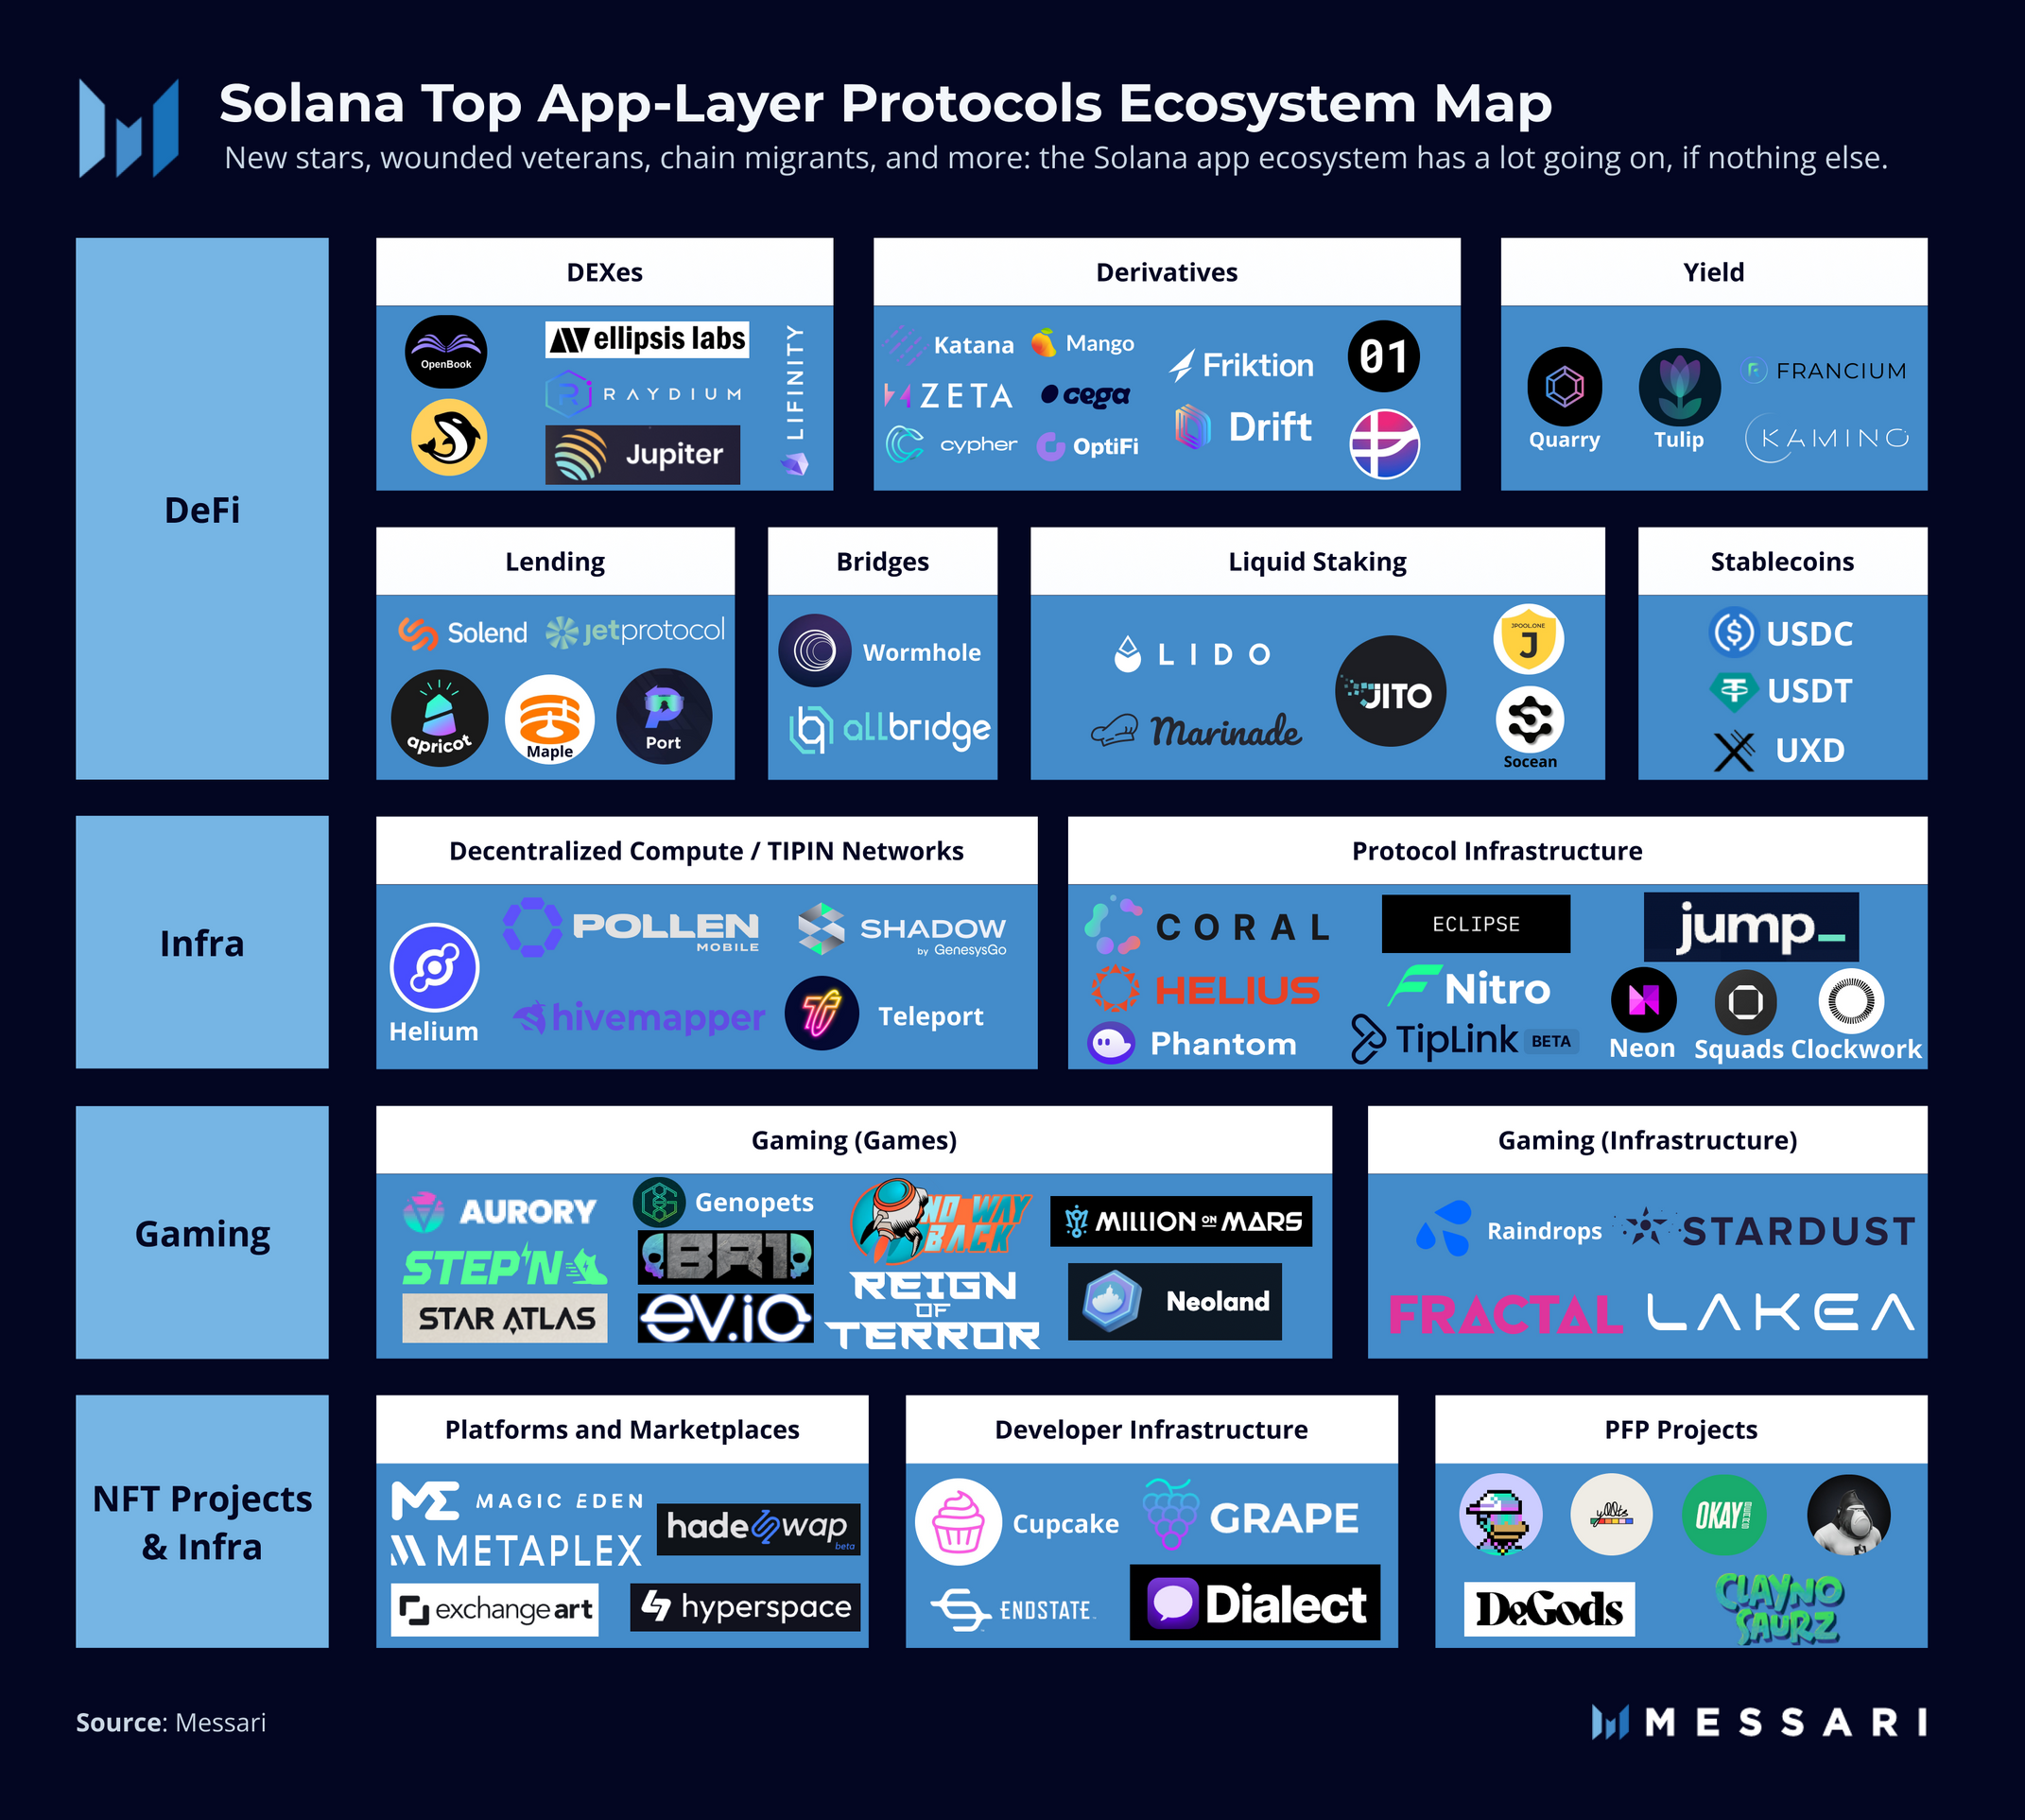
Visualizing these technical zones helps clarify the relationship between price action and moving averages. The following image illustrates the broader Solana ecosystem context, which underpins the fundamental demand driving these technical setups.
To track these indicators in real time, the interactive chart below displays the SOL/USD price action alongside EMA structures. This provider-backed widget allows for continuous monitoring of the technical levels discussed.
DeFi and AI Infrastructure Expansion
Solana’s valuation in 2026 is increasingly tethered to its capacity as a settlement layer for real-world assets (RWAs) and high-frequency DeFi applications. The network has moved beyond speculative trading volumes to anchor significant institutional capital. Recent ecosystem updates highlight $3 billion in RWA settlement volume, a metric that signals deep integration with traditional finance infrastructure. This shift provides a more stable revenue foundation compared to the volatility seen in previous cycles.
Parallel to DeFi growth, the integration of AI infrastructure is redefining Solana’s technical appeal. The network’s high throughput and low latency make it suitable for processing large data sets and executing AI-driven smart contracts in real time. Projects leveraging AI for predictive analytics and automated trading are increasingly deploying on Solana, utilizing its speed to execute complex computations without the bottlenecks present on legacy chains.
The convergence of these two sectors—DeFi and AI—creates a compound effect on network utility. As AI agents begin to manage DeFi positions autonomously, the demand for Solana’s block space rises. This structural demand supports the asset’s long-term trajectory, differentiating it from networks reliant solely on retail speculation. The following chart illustrates Solana’s recent price action, reflecting market sentiment around these fundamental developments.
Analyst forecasts and valuation ranges
Market analysts present a wide spectrum of price targets for Solana in 2026, reflecting the asset's volatility and the divergent methodologies used to model its growth. While some models rely on strict technical indicators like moving averages, others synthesize broader ecosystem adoption metrics to project long-term value.
Conservative technical analysis suggests a trading range between $75 and $86 for 2026, based on recent EMA structures where the 20-day and 50-day averages have recently flipped. In contrast, aggregated analyst sentiment places the mean forecast near $445, with bullish estimates reaching up to $1,000 as network utility expands.
To contextualize these varying projections, the table below compares specific forecasts from major financial analysis providers and aggregated analyst consensus.
| Source | 2026 Low | 2026 High | 2026 Mean | 2030 Projection |
|---|---|---|---|---|
| Changelly | $76.56 | $90.59 | $83.57 | $150+ |
| CoinDCX | $75.00 | $86.00 | $80.50 | $120+ |
| Analyst Mean | $300.00 | $1,000.00 | $445.00 | $800+ |
These disparities highlight the importance of source selection when evaluating Solana's potential. Technical models often cap upside based on current momentum, while fundamental analysts account for potential network upgrades and institutional adoption that may not yet be priced into short-term charts.

No comments yet. Be the first to share your thoughts!